Autocorrelation
Description
The autocorrelation function \(C(k)\) is a standard statistical tool to evaluate the temporal dependence of financial time-series.
\begin{equation}
C(k) = \frac{E[(x_{t}-\mu)(x_{t+k}-\mu)]}{\sigma^{2}}
\end{equation}
\(x_{t}\) is the value at time-step \(t\) and \(\mu\) and \(\sigma^{2}\) are the mean and variance of the time-series \(\{x_{t}\}\)
For the price return series, it is expected that the autocorrelation value takes \(C(k)\approx 0\) for any lag \(k\neq0\). It implies the linear unpredictability of financial time-series.
For the magnitude (i.e., absolute value, squared value) time-series, it is expected to observe volatility clustering, the slow decay of the autocorrelation function.

Fig. Averaged result for S&P500 firms daily price return
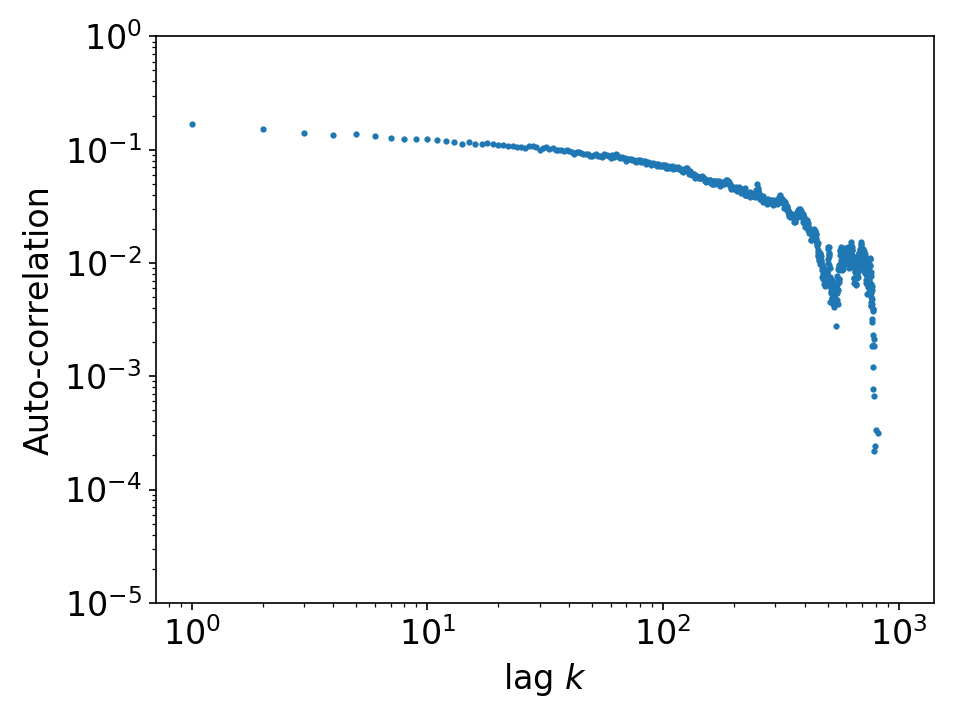
Fig. Averaged result for S&P500 firms daily absolute price return
Code Example
import datetime as dt
import pandas_datareader.data as web
import numpy as np
import stylefact.finance as sff
import stylefact.visualize as sfv
st = dt.datetime(1990,1,1)
en = dt.datetime(2020,1,1)
data = web.get_data_yahoo('GM', start=st, end=en)
prices = data['Adj Close'].to_numpy()
log_prices = np.log(prices)
returns = np.diff(log_prices)
x,y = sff.autocorrelation(returns)
sfv.autocorrelation(x,y,'autocorrelation',scale='linear')
x,y = sff.autocorrelation(np.abs(returns))
sfv.autocorrelation(x,y,'abs_autocorrelation',scale='log')